A few months ago, Applied Information was approached by a Marketing Executive to help determine the impact of their marketing campaigns on gas stations and thus their campaign’s effectiveness. This particular individual was focused on increasing their female clientele. The way they put it was “52% of single drivers in their region are women, but only 35% of their customers are women. We want to change that.”
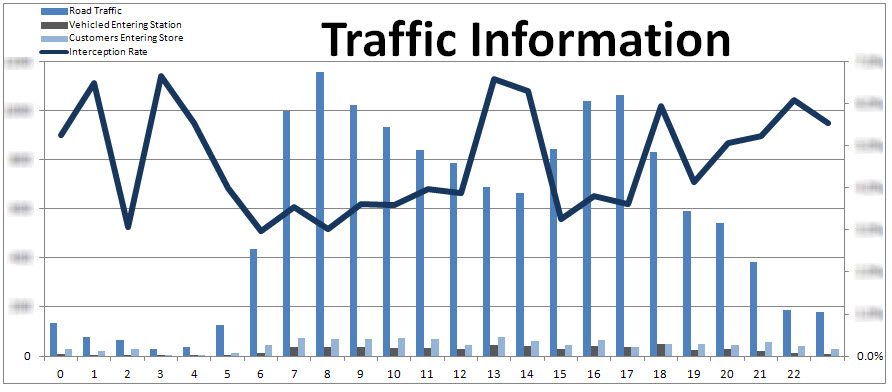
Applied Information leveraged their flexible Glance platform, radar technology, and engineered solutions capabilities to deploy pilot programs which are capable of counting the vehicles driving by the station and the vehicles entering the station. This ratio measures a site’s INTERCEPTION RATE. Using people counter technology, the ratio of customers entering the store versus vehicles entering the forecourt is computed, which is called the site’s CONVERSION RATE. Lastly, CUSTOMER DEMOGRAPHICS, including gender and age group, are gathered using camera technology.
All this information provides the insight needed to better manage the high costs of the typical marketing campaigns and determine its impact. When combined with sales dollar impact at a retail location and for specific products, this information provides a complete overview of the pre, during, and post campaign key performance indicators
Further insights into customer buying behaviors can be drilled down by time of day of reporting, integration into your POS data, and even weather conditions. Access to this information provides a powerful tool with which to measure the effectiveness of advertising campaigns, providing the information marketers need to review their strategy and make critical adjustments as necessary.
This first graph shows the volume of vehicles driving by the station and the count/percentage of vehicles entering the store, totaled each hour.

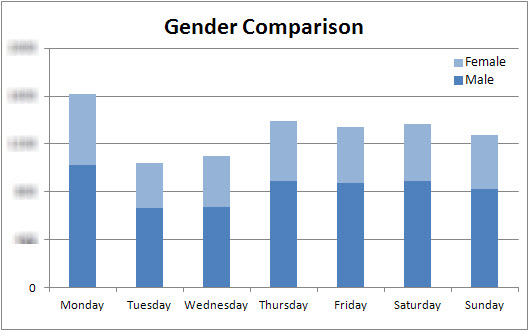
Here is a breakdown of Gender, shown as a daily total for a single week.
Contact us if you are interested in a more detailed report or to learn how to leverage this technology for your application.

