
Traffic signals drive both traffic safety and mobility, making it vital that they function properly. While federal regulators recommend retiming signals every three to seven years, changing city demographics and traffic patterns make more frequent retiming necessary to optimize traffic flow. The problem is that retiming signals is a time-consuming and expensive process.
The Federal Highway Administration’s (FHWA) Every Day Counts (EDC) program aims to address these kinds of problems with new and innovative technologies. In last year’s EDC-4 (2017-2018), the FHWA highlighted Automated Traffic Signal Performance Measures (ATSPMs) as a way to optimize traffic signal performance.
In this article, we will look at how ATSPMs are making it easier to collect traffic performance data that can be used to inform retiming decisions and optimize both safety and mobility. We’ll also review technologies that are improving upon these concepts, making the data easier to interpret and act upon for real results.
[bctt tweet=”Retiming and repairing traffic signals doesn’t have to be an expensive and time-consuming process.” username=”AppInfoInc”]
Collecting Traffic Data
It’s easy for users to spot traffic problems when they arise, but it’s much more difficult to build systems to identify and fix them. For example, it’s infuriating to be stopped at a red light for several minutes when there’s no cross traffic, but that doesn’t necessarily mean that the city should spend upwards of $4,500 to retime the intersection.
Many cities still rely on motorist complaints instead of performance data to identify problems with traffic signals. Traffic engineers are then dispatched to manually collect data and run time-consuming simulations to determine if there’s really a problem. In the meantime, intersections that actually require interventions are left on the back burner.
The good news is that automated systems are becoming increasingly popular for collecting data like cycle length, traffic counts, queue lengths, maximum vehicle delays, pedestrian actuation rates and corridor travel times. These data points can be invaluable in helping traffic engineers quickly diagnose and address problematic traffic signals.
[content_upgrade cu_id=”2723″]Download a complete checklist of key measurements for traffic signal performance.[content_upgrade_button]Click Here[/content_upgrade_button][/content_upgrade]
ATSPMs Pave the Way
The Federal Highway Administration’s Every Day Counts program has been actively promoting Automated Traffic Signal Performance Measures, or ATSPMs, as a way to improve retiming processes by continuously monitoring the performance of traffic signals. With the data from this approach, cities can dramatically improve response times and avoid relying on citizen complaints as a primary indicator of problems.
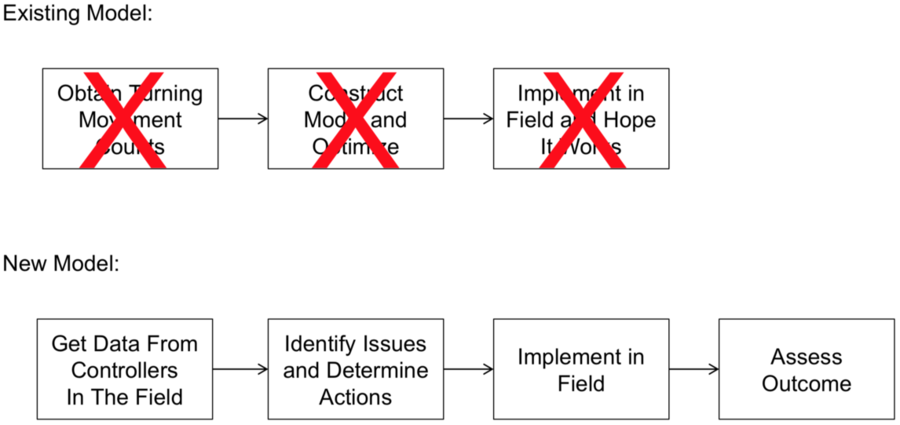
How ATSPMs Are Changing Traffic Performance Monitoring Processes Source: Traffic Signal Performance Measures Workshop
The Utah Department of Transportation (UDOT) developed an in-house automated system for displaying signal performance measures in 2013. In 2017, it released the software as an open source solution for all transportation agencies via the OSADP open source software portal. It has since become a popular option for implementing automated traffic performance monitoring systems.
ATSPMs, like UDOT’s software, make existing traffic signal infrastructure capable of in-depth data-logging, while also analyzing this data for insights into the traffic system. Armed with this data, traffic engineers can proactively identify and correct any deficiencies, as well as improve traffic safety and congestion before problems occur.
![]()
Making Sense of Data Madness
ATSPMs may have become the most ubiquitous form of traffic performance monitoring, but they’re not the most user-friendly option when it comes to analyzing traffic performance. While it’s important to gather the right kind of data, it’s equally important to be able to effectively interpret that data in order to make informed decisions.
New technologies are helping to simplify the process by giving a context to traffic performance data and even automating the process of deploying traffic engineers to address problems.
Glance Performance Measures is a new diagnostic and reporting tool that Applied Information launched to help traffic engineers see exactly where problems occur in their transportation network. In addition to providing insights (rather than raw data), the wider Glance system can direct maintenance efforts to locations that need fixing.
Unlike many standalone traffic performance monitoring solutions, which can be extremely costly, Glance Performance Measures is included with the Glance Smart City Supervisory System at no additional cost. Glance Performance Measures is fully integrated with other smart city functions to help optimize traffic performance and improve overall safety.
Building a Smarter City
Retiming signals and proactively addressing their maintenance needs is only one piece of a much larger puzzle when it comes to reducing traffic congestion and improving safety. Smart city technologies make it possible to access and act on data in ways that were never before possible by using new sensors and communication technology.
For example, Glance can show the real-time location and status of every connected traffic asset in a single cloud-based web application. Traffic engineers can immediately receive a notification when a signal failure or malfunction is detected, allowing them to dispatch service personnel to the exact location before citizens even notice an issue.
Smart cities are also empowering motorists, cyclists and pedestrians with new technologies to improve their safety. For example, Applied Information’s TravelSafely app connects all of these travelers to existing traffic infrastructure to provide alerts in potentially dangerous situations, such as when a car is approaching a crosswalk too quickly. Eventually, the same technology could be applied to connected vehicles.
The value of these solutions becomes apparent when you look at the big impact of small changes. For instance, the Traffic Signal Performance Measures Workshop highlights how fixing a single malfunctioning detector produced $900,000 in annual user benefits and how fixing a communication failure improved traffic congestion by 50 percent in three months.
Getting Started with Glance
Applied Information provides a wide range of smart city solutions designed to reduce traffic congestion and improve the safety of motorists, cyclists, and pedestrians.
For example, some of our smart city products include:
- School Zone Flashing Beacons
- Priority and Preemption Technology
- Traffic Intersection Systems
- Parking Solutions
- ITS Systems
- Mobile Field Unit Monitoring
These products all interface with the Glance Smart City Supervisory System, which provides convenient access to all of your ITS assets via a cloud-based web application. And with performance monitoring built-in, you can ensure that everything is running optimally.
If you’re interested in learning more about Glance, contact us today for a consultation and demo.
[content_upgrade cu_id=”2723″]Don’t forget to download a complete checklist of key measurements for traffic signal performance.[content_upgrade_button]Click Here[/content_upgrade_button][/content_upgrade]